Fostex and RTA experiments
First time with Fostex drivers and first RTA experiments. It is interesting to get immediate detailed info on how each change effects performance..
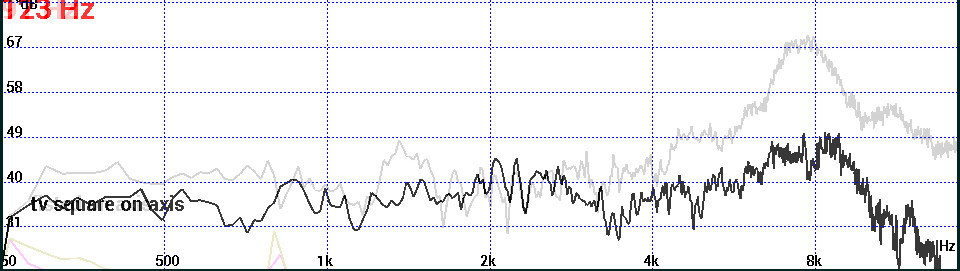
This above is an initial rough comparison of two drivers, in similar test boxes (rough partly because I haven't yet found a way to overlay the curves in software, so I've done it with screen captures and an image editor).
The pale line is a Fostex FF105WK measured nearfield, on axis, no crossover.
The dark line is a no-name, very cheap looking, small, elliptical speaker I collected recently from an old TV.
The no-name driver measures a lot flatter, obviously. My girlfriend flat out prefers how it sounds. Overall I agree with her, but do like the Fostex HF extension.
Crossover experiments
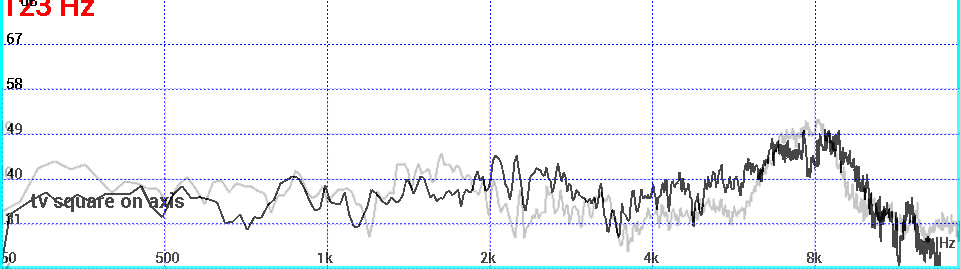
Listening off axis doesn't really reduce the 8 kHz hump as I thought it would - it mostly just rolls off the extreme HF.
The pale trace below is the Fostex 45 degrees off axis, with a complicated smiley-face filter. This gets it almost as flat as the TV speaker, but with a little more HF extension. I guess I'll either dial this in to perfection, or just use the speakers I picked up for free.
The pale trace below is the Fostex 45 degrees off axis, with a complicated smiley-face filter. This gets it almost as flat as the TV speaker, but with a little more HF extension. I guess I'll either dial this in to perfection, or just use the speakers I picked up for free.
Update - better tests
Using a calibrated mic, a more rigid test baffle, and having realised how to load the AT files into my (open source) spreadsheet software, I have produced some different, possibly better graphs.
Below is a smoothed graph of the Fostex on a big OB, showing a nice mid range response and nice treble extension, marred only by the notch and spike at 5 and 7 kHz. Quite a different image to the screen capture above.
Below is a smoothed graph of the Fostex on a big OB, showing a nice mid range response and nice treble extension, marred only by the notch and spike at 5 and 7 kHz. Quite a different image to the screen capture above.
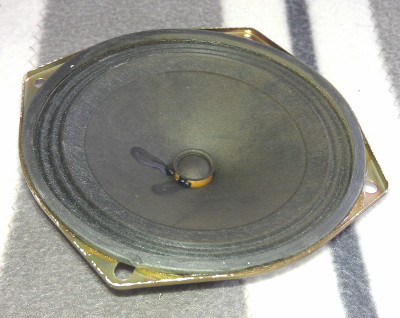
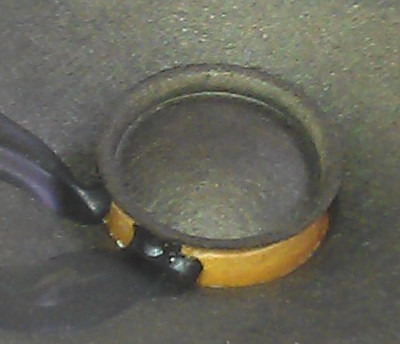
Below is a half-decent TV speaker I've been using / comparing with the Fostex.
|
|
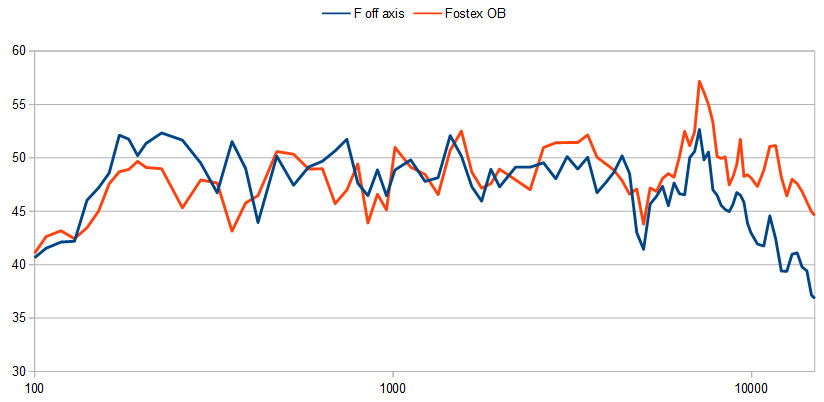
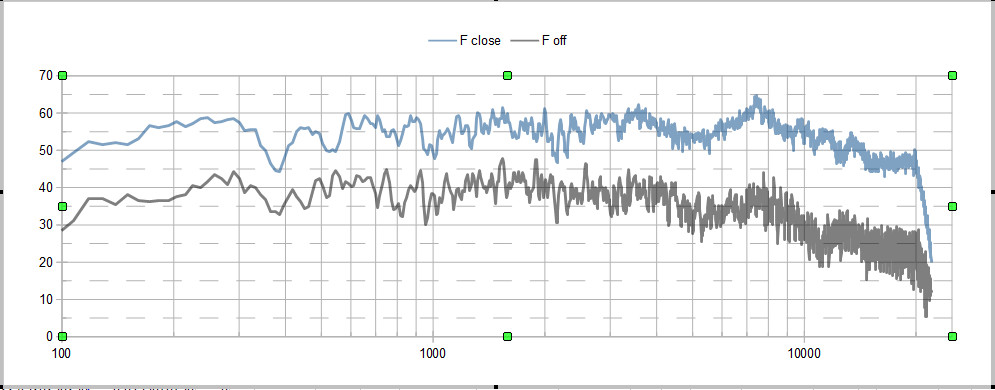
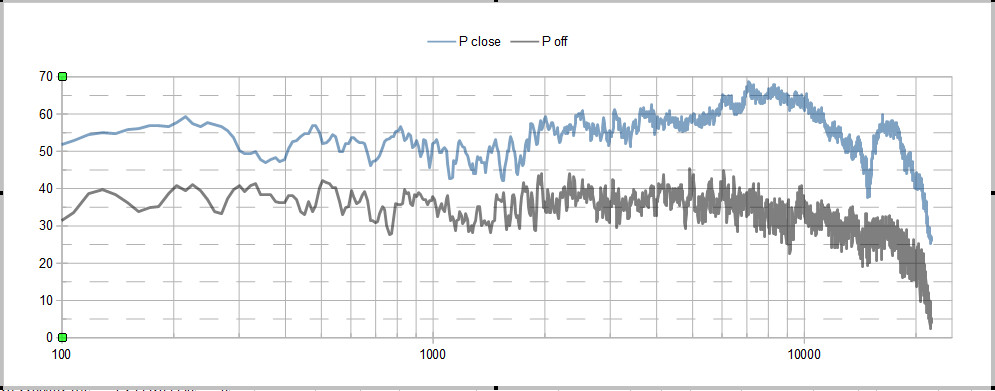
Below the two drivers are compared. The plots show each speaker (left is F for Fostex, right P for Phillips TV) measured close (50cm) on axis, plus a far, off axis plot. The latter is shifted down 10dB for viewing clarity.
Both look pretty good, and smoother off axis than on.
The TV speaker has surprisingly excellent off axis response, given that its dust cap is quite primitive looking. Perhaps the small lip acts as a tiny whizzer cone.
Note: you can view these images fullscreen for more detail.
Both look pretty good, and smoother off axis than on.
The TV speaker has surprisingly excellent off axis response, given that its dust cap is quite primitive looking. Perhaps the small lip acts as a tiny whizzer cone.
Note: you can view these images fullscreen for more detail.
|
|
This final chart is a simple distortion test. I really need to learn more about this - it seems that the Fostex has lots more 2nd harmonic, but maybe I'm measuring it wrong.
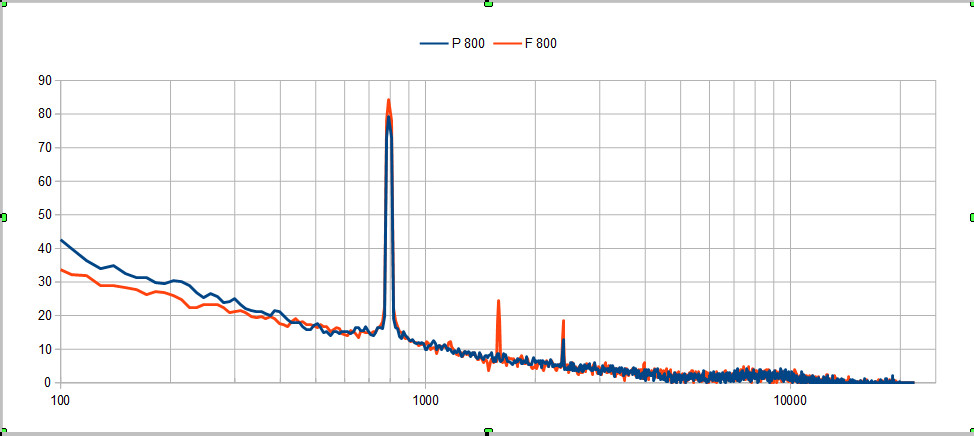
If the Fostex is more of a distortion generator, that may answer the vexed question of why I only like it for smooth / easy listening music. I tried playing rock music through the Fostex today, and couldn't get through a song... but with the Phillips on the same OB, I enjoyed the whole album.
UPDATE: tried some 2 tone (IM distortion) tests, expecting to see evidence of the Fostex speakers 7kHz resonance, and couldn't get convincing / consistent results. The graph above may be a fluke / not really representative.
UPDATE: tried some 2 tone (IM distortion) tests, expecting to see evidence of the Fostex speakers 7kHz resonance, and couldn't get convincing / consistent results. The graph above may be a fluke / not really representative.
